
In the modern workplace, data isn't just a collection of numbers—it's the heartbeat of your organization. Understanding your workforce's demographics, distribution, and milestones is crucial for making informed strategic decisions. Today, we’re diving into the **HR Dashboard** module for Odoo 18 and Odoo 19, a powerful tool designed to bring your Human Resources data to life.
Why a Dedicated HR Dashboard?
Odoo provides excellent tracking for employees, but sometimes you need a "bird's-eye view" that standard list and kanban views can't provide. This dashboard consolidates critical metrics into a single, visually stunning interface, allowing HR managers to spot trends at a glance.
Key Features
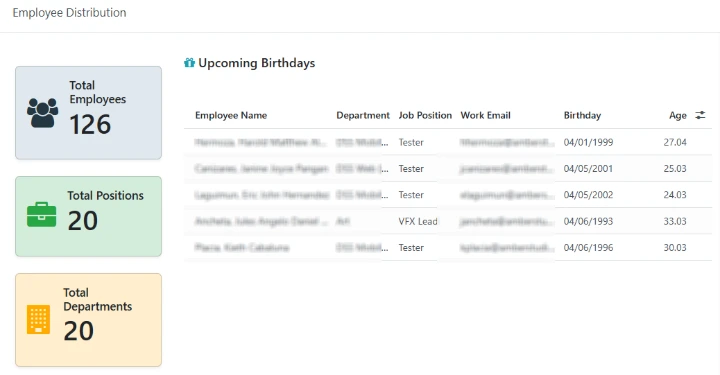
1. Real-Time KPI Cards
At the top of the dashboard, three high-visibility cards give you the "Big Three" metrics:
Total Employee Count: Know exactly how many people power your company.
Department Count: See the breadth of your organizational structure.
Position Count: Track the diversity of roles within your team.
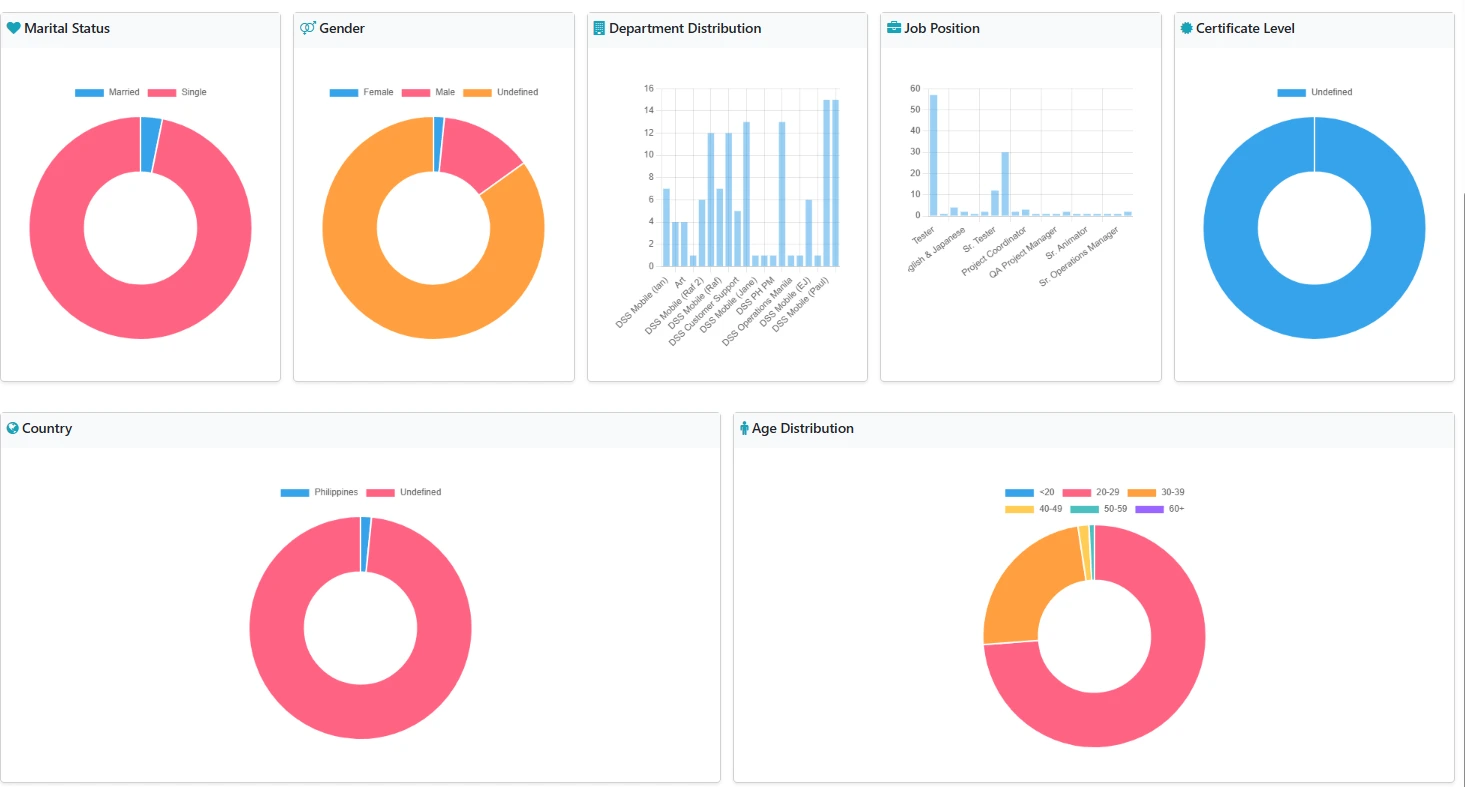
2. Interactive Demographic Visualizations
Using integrated Chart.js visualizations, the dashboard breaks down your workforce across several dimensions:
- Department Distribution: A bar chart showing where your talent is concentrated.
- Gender & Marital Status: Doughnut charts providing clear insights into workforce diversity.
- Age Distribution: Grouped analysis (from <20 to 60+) to help with succession planning and culture building.
- Global Reach: Visual representation of employee nationalities and certificate levels.
3. Employee Milestones: Upcoming Birthdays
Never miss a celebration again! The dashboard includes a dedicated section for **Upcoming Birthdays** within the current month. It even calculates the employee's age automatically, making it easy to coordinate team surprises or recognition.
A Peek Under the Hood
For the Odoo developers out there, this module is a great example of how to combine Python's data processing with OWL (Odoo Web Library) and Chart.js.
The Hybrid Model
The `hr.dashboard` model is a "virtual" model (`_auto = False`), which means it doesn't create a standard table in your database. Instead, it uses a SQL view to provide a single record that acts as the container for all the dashboard's computed data.
Custom OWL Widget
The magic of the charts happens in a custom OWL component called GraphWidget. It takes JSON data computed in Python and renders it using Chart.js directly within the Odoo form view.
/** @odoo-module **/
import { registry } from"@web/core/registry";
import { Component, onMounted, useRef } from"@odoo/owl";
import { loadJS } from"@web/core/assets";
class GraphWidgetextends Component {
    statictemplate = "hr_dashboard.GraphWidget";
    // ... setup and renderChart logic ...
}
registry.category("fields").add("graph_widget", { component: GraphWidget });
Dynamic Styling
The module uses Odoo's built-in Bootstrap utilities (`bg-primary-subtle`, `shadow-sm`, etc.) to ensure the dashboard feels like a native part of the Odoo ecosystem while maintaining a modern, clean aesthetic.
Conclusion
The HR Dashboard is more than just a pretty interface; it's a strategic tool. By transforming raw employee data into actionable insights, it empowers HR professionals to lead with data-driven confidence.
Ready to transform your HR management? This module shows exactly how flexible Odoo can be when you combine its robust backend with modern web technologies.